Six analytical views. One transparent workspace.
The captures below show the actual terminal interface. Every view depends on available third-party market data and has explicit limitations.
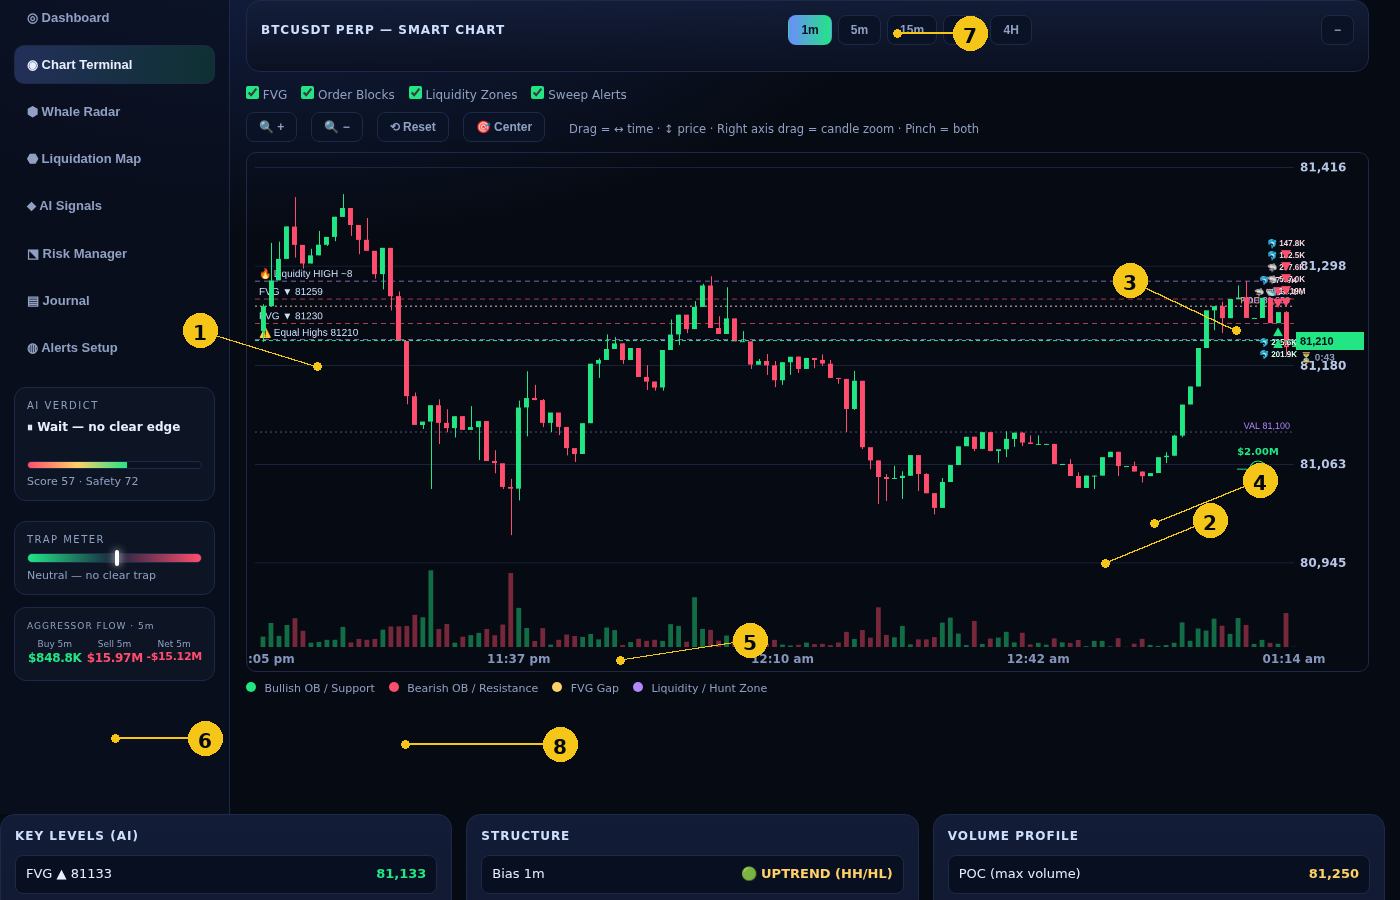
📊 Smart Chart — structure and large prints
Configured overlays and large exchange-reported trade prints are placed alongside price candles for visual context.
- Large-print markers with available price, time and size
- Five-minute aggressor flow in displayed dollars
- Five chart timeframes from 1 minute to 4 hours
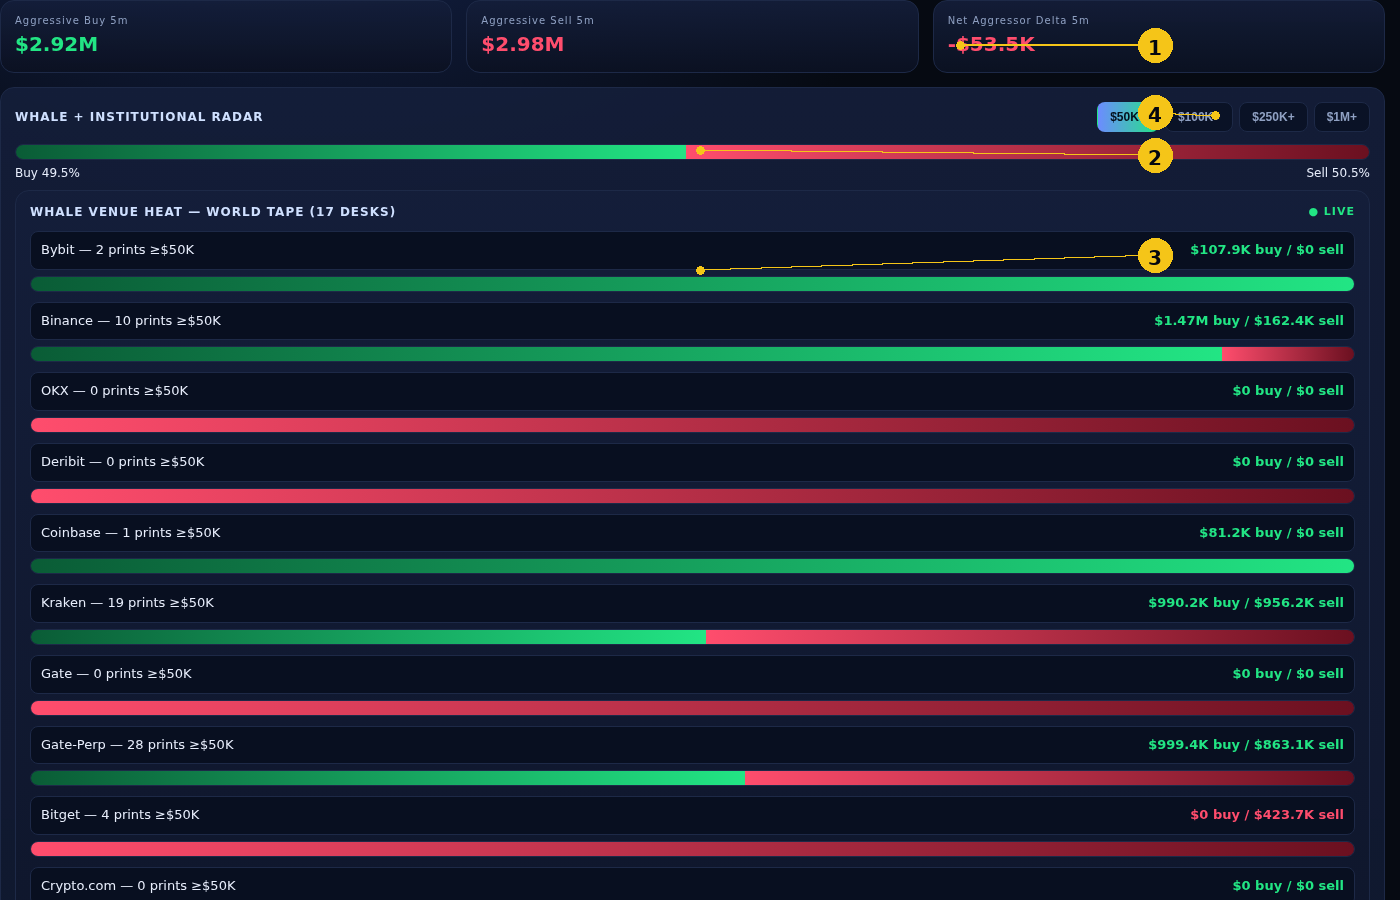
🐋 17-Venue World Tape — consolidated activity
Venue rows display available trade-print counts, dollar splits and buy/sell flow with a live or stale status for each feed.
- Multiple supported exchange data sources in one view
- Configurable large-print size filters
- Five-minute descriptive flow bar
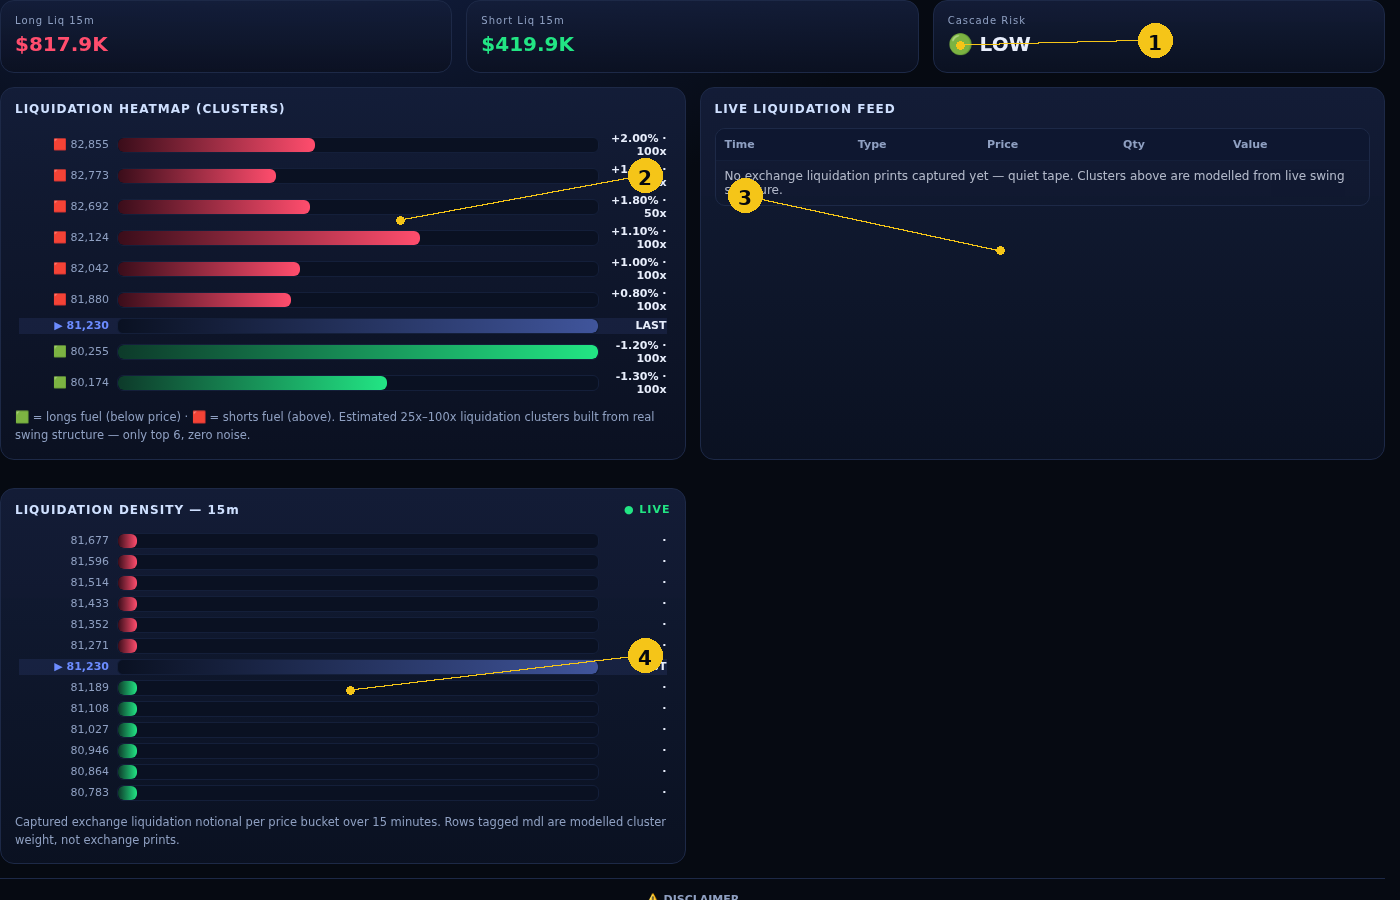
🔥 Liquidation View — available forced-order data
Observed liquidation information is organised by location, density and distance from the displayed last price.
- Cluster view with distance and leverage labels
- Fifteen-minute density around displayed price
- Descriptive cascade-risk meter; not a prediction
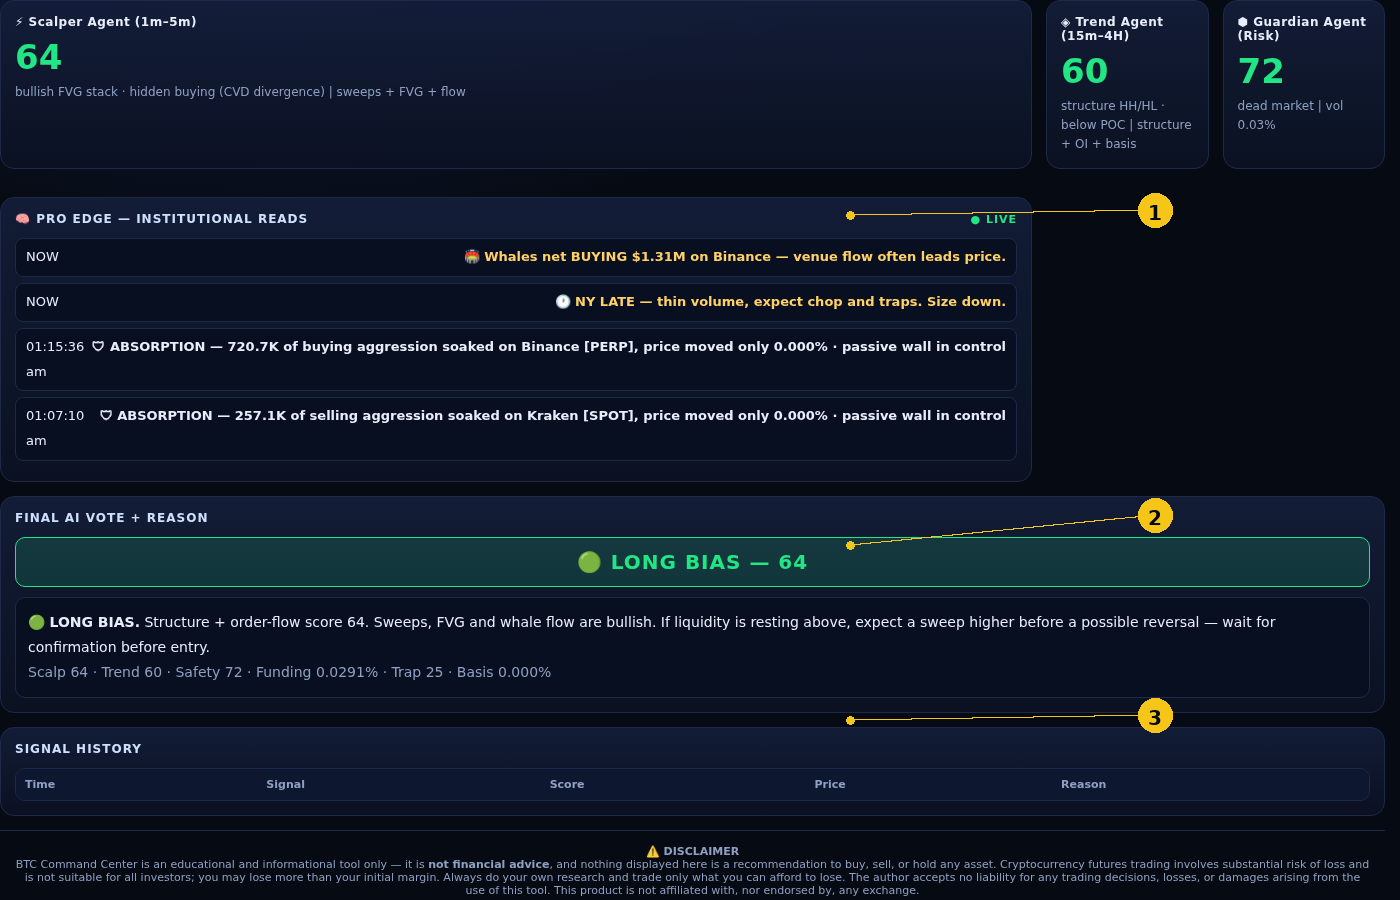
🤖 Model-Assisted Context — reasons, not instructions
Three named analytical lenses—Scalper, Trend and Guardian—summarise displayed chart, flow and risk inputs. These labels do not represent personalized advisers.
- Descriptive context with the input case written out
- Displayed inputs remain available for independent review
- Conflicting context can return WAIT instead of a directional label
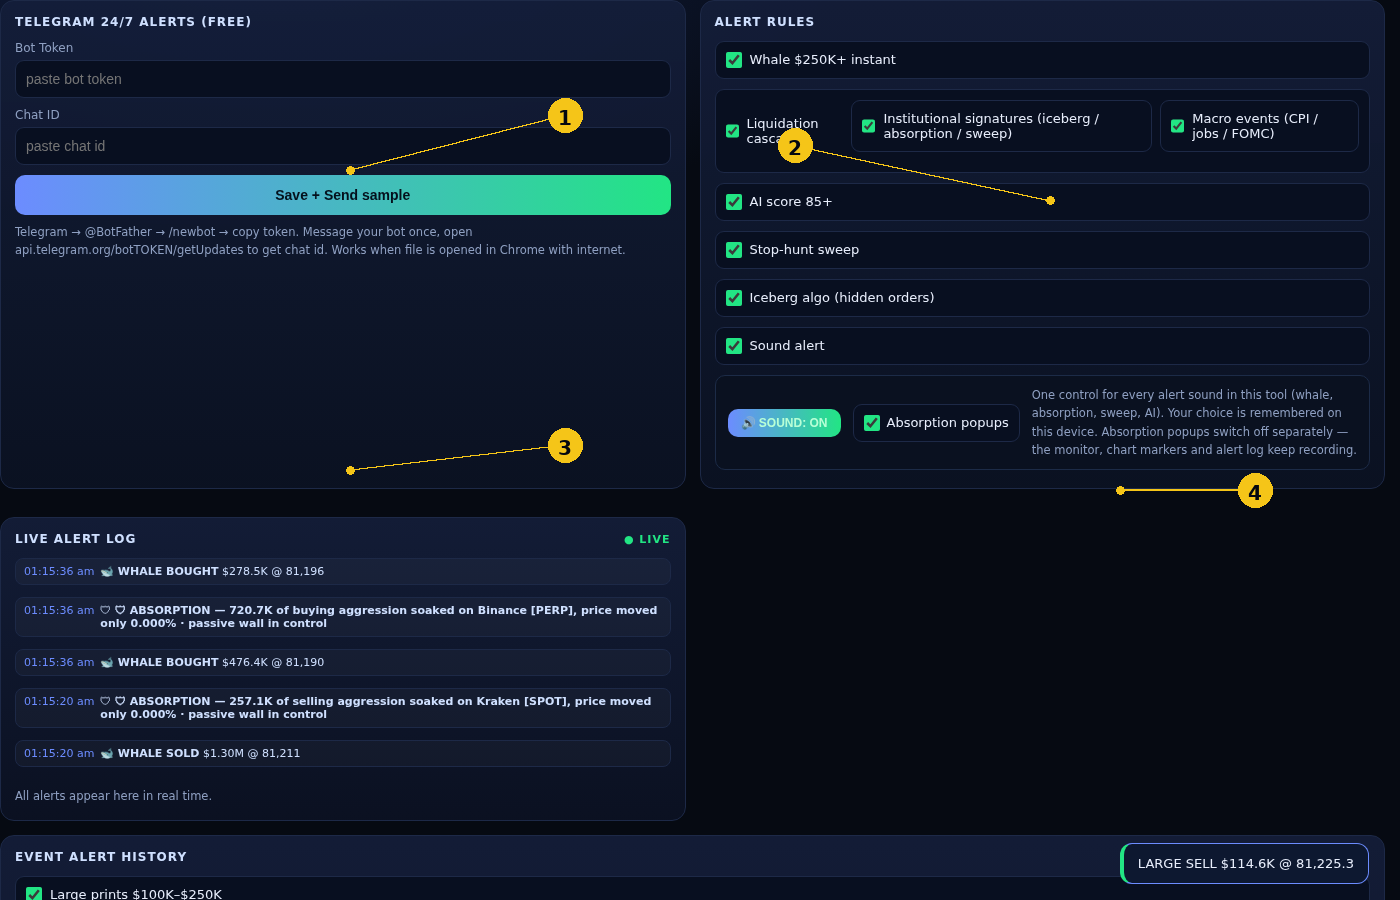
🔔 Market-Event Alerts — optional notifications
Members can configure notifications for observed large prints, liquidation activity, sweeps, macro events and other displayed conditions.
- Private Telegram-bot setup for an active member
- Live log describes observed market events
- Sound controls and on-screen notices
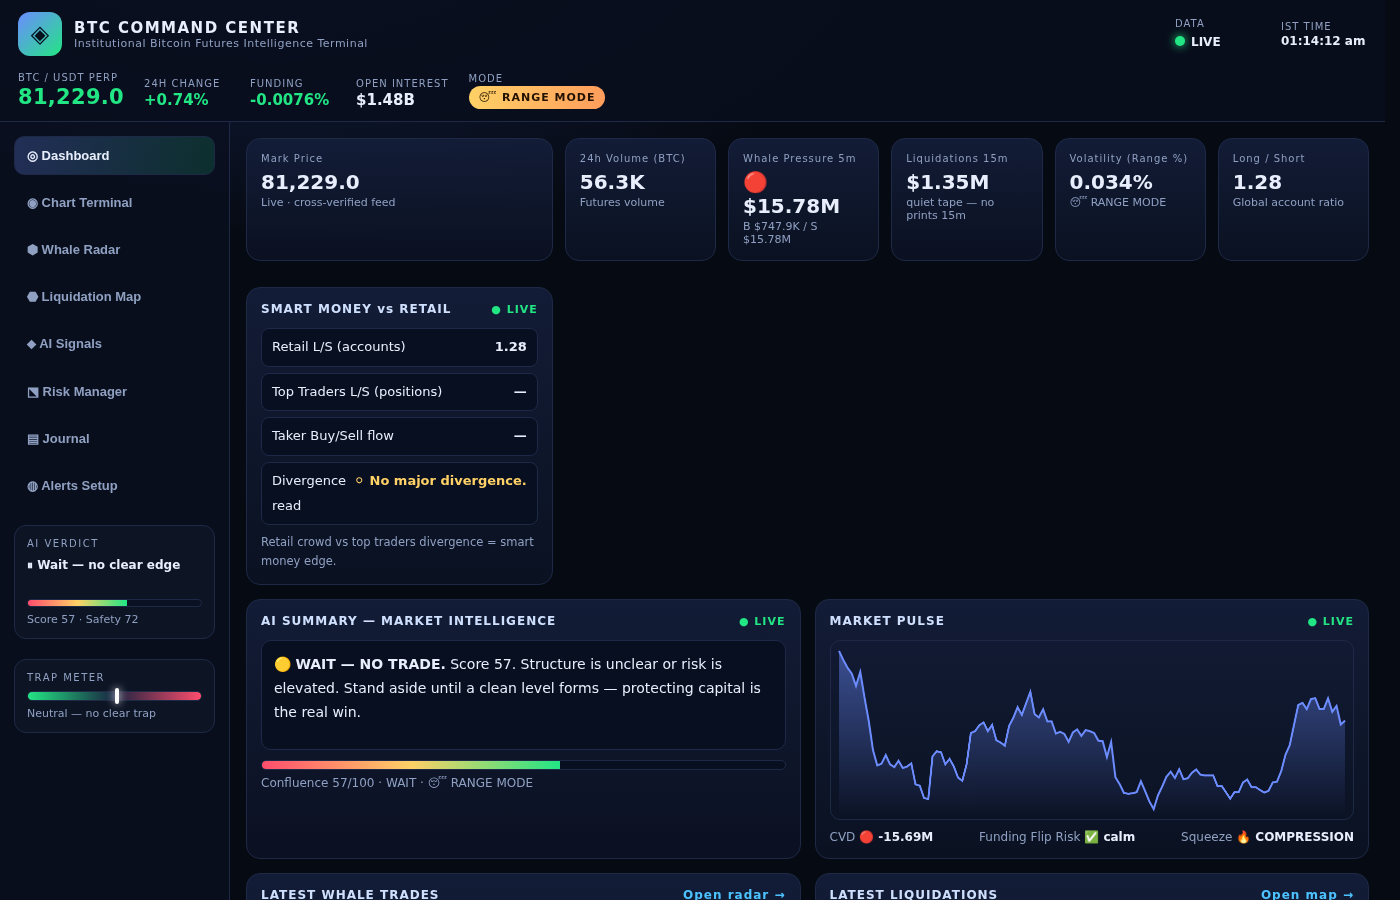
🛡️ Dashboard, Risk + Journal — organized context
A summary view combines displayed pressure, market pulse and risk context with position-risk framing and a personal journal.
- Consolidated market-data summary
- Descriptive bull/bear trap-risk meter
- Private journal beside the analytical views
Feature boundaries.
What each tool displays—and what it cannot promise.
| View | Displayed function | Important limitation |
|---|---|---|
| Large-trade tape | Consolidates available venue prints | Trade size does not identify intent or owner |
| Smart chart | Visualises configured structure and prints | An overlay is not an order or recommendation |
| Liquidation view | Organises available liquidation activity | Upstream data can be incomplete or delayed |
| Model-assisted context | Summarises displayed inputs with reasons | It does not know personal objectives or predict results |
| Event alerts | Reports configured observed conditions | Delivery timing is not guaranteed |
| Risk and journal | Frames user-entered risk and records notes | The user remains responsible for every decision |
BTC Command Center does not execute trades, connect to exchange funds, custody assets, operate a wallet or provide personalized investment advice.